Testing
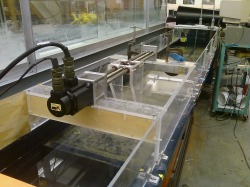
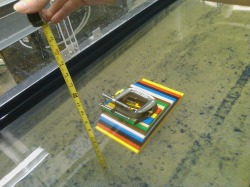
During testing, the model was placed in the middle of the wave flume. The frequency of the waves was then set. The initial wave height was measured on the upstream side of the model. At the same moment, the final wave height was measured with a ruler at the downstream side of the model. These values were then recorded and input into Microsoft Excel to produce a table of the average percent reduction in wave height due to the affects of the BeachSaverTM model.
The different situations were tested in the experiment, keeping the freeboard the exact same for all three tests. The first test was placing the model with the steeper side upstream and therefore affecting the wave first. The second was placing the steeper side downstream and lastly, we placed the model on a 45 degree angle to the motion of the waves. All three of these tests were performed three times each and the average of the wave reduction was calculated from averaging the data collected from the three trials.
Testing procedures were altered when the Logo model did now show enough stability or sinkability in the wave flume. Metal clamps were needed to secure the model to the bottom of the tank and resist the wave forces. This addition was included in the freeboard calculations; however, might have an impact on the wave reduction results.